


Combination of STAT and SQL
Hello People!
I am Nishtha a data aspirant, on a journey of learning everything about data handling and manipulation. I am looking forward to building a career in the data field and here i am journaling my journey.
On day 1, I started with learning the very basic concepts of statistics which are used in manipulating data. Moving forward i am going to discuss about these concept and what queries (in MySql) we can write to find them. First of all, let's try to understand,
What is a measure of Central Tendency?
A measure of central tendency is a one-number summary of a set of data points.. They help to summarise the data and understand its distribution. The three main measures of central tendency are:
- MEAN
The “average” number; found by adding all data points and dividing by the number of data points.
Calculating the Mean is very straight forward. We can use the AVG() aggregate function.
- MODE
The most frequent number — that is, the number that occurs the highest number of times.
For calculating the Mode, we can count the number of records in each category and obtain the group with highest count using the MAX() function.
- MEDIAN
The middle number; found by ordering all data points and picking out the one in the middle (or if there are two middle numbers, taking the mean of those two numbers).
Calculating the Median is comparatively a little tricky as there are no direct functions to do so. But, it is still absolutely possible to calculate Median in SQL. Not in one, but in many ways.
Calculating the Median in SQL
First of all, we need to understand the mathematical formula to find median,
For a dataset, having N elements, ordered from smallest to greatest:
Median = ( N+1 )/ 2th element , if N is odd
Median = ( N/2th element + (N/2 + 1)th element )/2, if N is even
From the above formulae, we have keep in mind that the dataset must be ordered and we need to account for odd and even number of data points.
1) By Using ROW_NUMBER() Window Function
SELECT AVG(list_price) AS "Median"
FROM
(
   SELECT list_price,
      ROW_NUMBER() OVER (ORDER BY list_price ASC, order_id ASC) AS RowAsc,
      ROW_NUMBER() OVER (ORDER BY list_price DESC, order_id DESC) AS RowDesc
   FROM sales.order_items
) data
WHERE
   RowAsc IN (RowDesc, RowDesc - 1, RowDesc + 1)
The above query first assigns row numbers in ascending and descending order to each row based on the list_price and order_id. The subquery retrieves the list_price and the corresponding row numbers for both ascending and descending order. The outer query calculates the average of the list_price where the row number in ascending order is either equal to or within one position from the row number in descending order.
2) By Using NTILE() Window Function
SELECT MAX(list_price) AS "Median"
FROM (
 SELECT list_price,
 NTILE(4) OVER(ORDER BY list_price) AS Quartile
 FROM sales.order_items
) X
WHERE Quartile = 2
The NTILE function divides the result set into 4 equal parts (quartiles). The ORDER BY list_price sorts the list prices in ascending order. The outer query selects the maximum list price from the subquery where Quartile is 2, representing the second quartile, which is the median.
3) By Using PERCENTILE_CONT() Window Function
SELECT DISTINCT PERCENTILE_CONT(0.5)
  WITHIN GROUP (ORDER BY list_price) OVER() AS "Median"
FROM sales.order_items
The PERCENTILE_CONT function calculates a specific percentile for a given column within a group. The 0.5 argument indicates that we want to find the 50th percentile, which is the median. The ORDER BY list_price clause ensures that the list prices are sorted in ascending order before calculating the median. The DISTINCT keyword makes sure that we only get one result for the overall median, even if there are multiple rows with the same median value. The OVER() function is used without any partitioning, so the PERCENTILE_CONT is applied to the entire result set.
How are these measures used in the context of data?
Now, let's discuss how these terms are helpful in context of data. Whenever we work on a dataset, one of the first things that we do is handle the missing values.
Let's say, we have a dataset with some null values. We conclude that we will replace the nulls with appropriate values. The simplest and most novice way would be to use measures of central tendency.
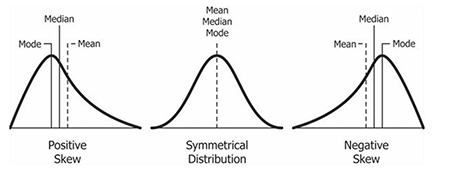
If our data is continuous, we can use mean or median, depending on the distribution of data.
For normally distributed data, the mean can be used ( it can be heavily influenced by outliers or extremely high or low values)
For skewed data, the median is the more accurate measure, as it is less sensitive to outliers than the mean.
Mode is suitable for categorical variables or numerical variables with a small number of unique values.
Question of the day: https://www.hackerrank.com/challenges/weather-observation-station-20/problem
That is all I had to share from my learnings. See you in the next blog.